In the July 2022 edition of ACA Data Insights, the Queen City Angels (QCA) offered “Measuring Member Engagement as Driver of Angel Group Success” summarizing a comprehensive study of six years of data related to member engagement. This is the first sequel to that Insight. QCA defined “engagement” as a member’s commitment to QCA’s success as demonstrated by their intellectual contributions and participation in activities key to the organization’s mission.
The key activities that provided the input data for this study included individual member attendance at regular investor meetings; serving on deal screening or due diligence teams; post investment governance activities; and/or, serving on standing QCA committees.
The high-level data analysis revealed:
- The percent of active member engagement far exceeded the Pareto Principle in all categories that were analyzed.
- Active membership more than doubled in the six-year time frame, and the regular meeting attendance (as a percent of active members) increased by more than 25%.
- Service on both due diligence committees and screening committees was broadly distributed throughout the membership. For these committees, engagement doubled over the six years considered.
- Member engagement kept pace with the expansion of companies being considered. Despite the growing number of companies being screened, and/or moving into due diligence, and/or receiving an investment, the percent of active members’ engagement, per company, was consistent (at a high level) over the six-year period, for all categories analyzed.
Angel investor groups, like other volunteer organizations, are enabled by the level of individual member engagement. Intuitively, one might assume that the level of member engagement in combination with members’ experience and expertise would be directly related to an angel group improving its investment outcomes. To help assess if this is indeed the case and the degree of improved outcomes, some questions come to mind such as the following:
- What level of individual member engagement within an angel investor group is needed and should be expected for the group to achieve their goals?
- Can more be accomplished simply through a greater level of member engagement, and if so, what should be the expectation for individual investor engagement?
Given the findings reported in the July 2022 ACA Data Insights, QCA members’ engagement was higher than expected and indicates a broader distribution of the required workload among QCA members. The tracking shows more members are gaining valuable experience and developing the needed expertise to better evaluate companies coming through the pipeline, thus leading to better investment decisions. Now that QCA has a better understanding of the data as to member engagement, has that level of engagement driven better results? How do we measure and evaluate those results? How are the results related to engagement?
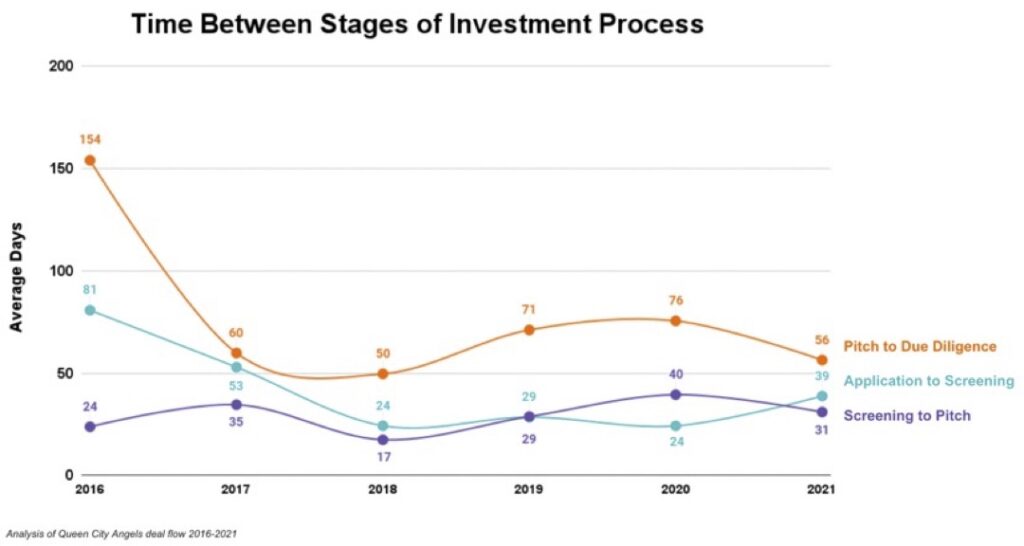
To answer these questions, we had to dig ‘‘deeper” into the data especially as it relates to screening committees, due diligence activities and the portfolio companies that received investments from QCA within the six-year (2016-2021) study period.
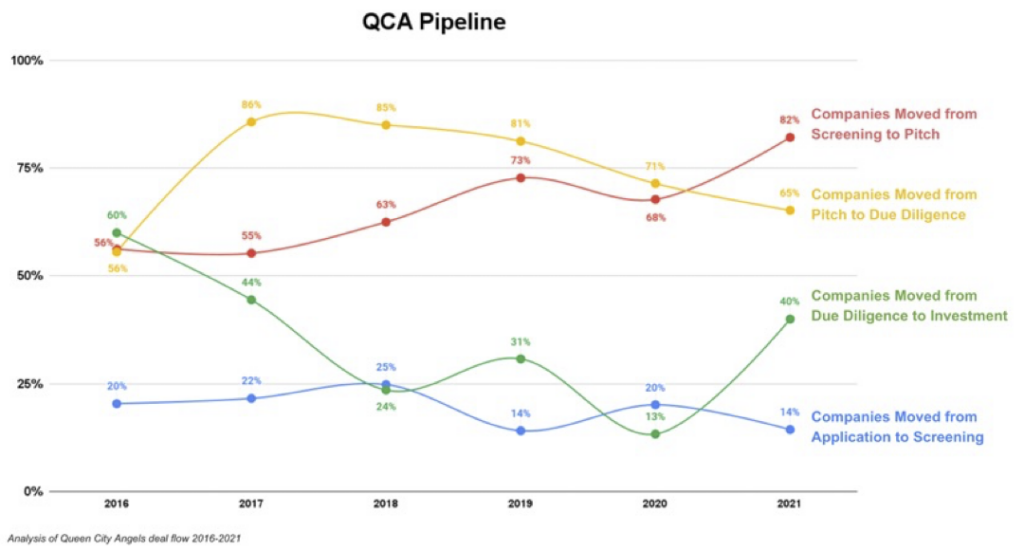
The initial data analysis (shown in the graph below) illustrates the QCA “deal pipeline” for the study period, i.e., those companies who applied for funding from QCA and progressed toward an investment. More specifically, we considered a year-by-year comparison of the number of companies that:
- Applied for funding
- Were pre-screened and advanced to an in-person meeting with a QCA screening committee
- Advanced to the opportunity to present at a QCA investor meeting, and
- Advanced to due diligence and ultimately funded by QCA.