 Wednesday, September 28, 2022
A Comparison Of Life Sciences Outcomes Compared To Other Verticals
As angels, we often ask ourselves whether returns in one industry are likely to be better than other industries. In recent years, TCA has invested about 35-40% each year in Life Sciences.
Since TCA’s founding in 1997, we have invested in more than 500 companies and 123 (32%) of these have been in Life Sciences. Of the total investment, 25% has been in Life Sciences. Therefore, the dataset is large enough to perhaps develop some observations and conclusions comparing Life Sciences to all other verticals combined.
A few quick observations/conclusions:
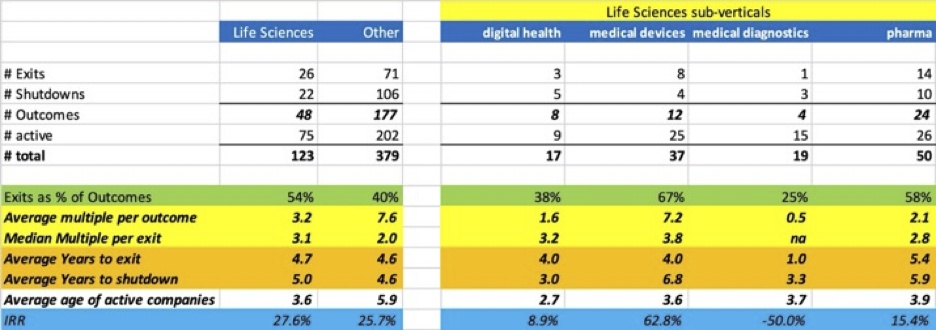
- Life Sciences companies have a higher % of outcomes that are exits compared to other industry verticals — 54% vs 40%.
- The IRR is also higher — 27.6% for Life Sciences compared to 25.7% for other verticals.
- The average years to exit are comparable for Life Sciences — 4.7 vs 4.6 years.
- But the number of years before shutdown is slightly more — 5.0 vs 4.6 years. This may because it takes longer to validate (or invalidate) the value proposition in clinical trials compared to customer validation through minimum viable products for in other industries.
- The median multiple realized per exit of 3.1x for Life Sciences is higher than the 2.0x median multiple per exit for all other verticals.
- However, the average multiple realized on all outcomes is lower — 3.2x for Life Sciences compared to 7.6x for other verticals.
Much of this difference in average multiples realized is due to far more “grand slam home runs” in industries other than Life Sciences (at least that is true of TCA’s experience so far). Of TCA’s 15 largest “grand slams," only two have been in Life Sciences:
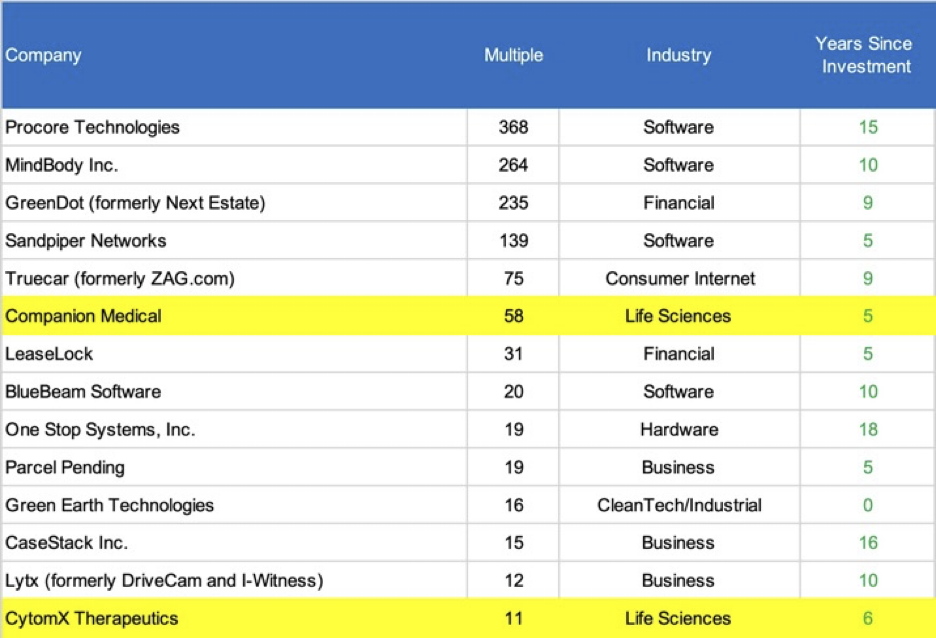
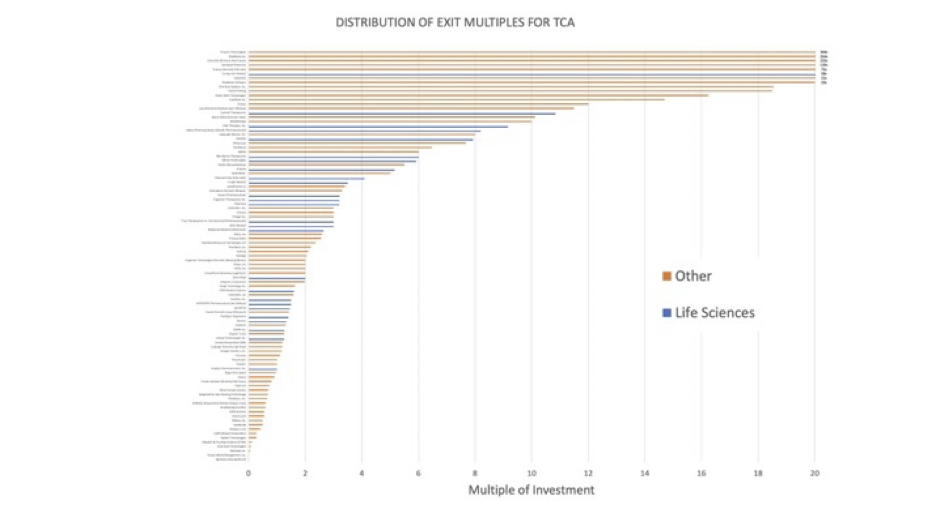
This skew is evident in the overall distribution of returns, where the “sweet spot” for Life Sciences seems to be a multiple of 3x – 9x:
Why this discrepancy between IRR and multiple realized for Life Sciences? For Life Sciences, the total amount of eventual investment needed tends to be higher because the FDA approval process means it takes longer to reach revenue (my hypothesis since I don’t have the data to prove or disprove this) and often that investment comes without large upticks in valuation. Also, many Life Sciences exits are made early on to strategic buyers once the technology is proven (with FDA approval) but before the company achieves significant revenue; this also may mean fewer home runs since strategic buyers have active programs to pick up companies well before they have significant revenues. As such, the market cap of these earlier exits tends to be less (again a hypothesis on my part which I can’t test since I have that info for only a subset of the companies). The biggest TCA exits in “non-Life Sciences” took much longer to develop significant revenue before IPOs (e.g GreenDot, Mindbody and Procore), and that depresses the IRR overall for that group; the two Life Sciences exits in this top 15 group were at 5 and 6 years, compared to 9, 10 and 15 years respectively for Greendot, Mindbody and Procore. If I had data on revenues at the time of exit, my hypothesis is that Life Sciences exits tend to be smaller in $ value because some of the other verticals have companies that have grown to significant revenues by the time they IPO or are acquired.
From a public policy perspective, these results suggest that the decision to support Life Sciences (through NIH grants) makes sense. Many Life Sciences start-ups initially are still in a research stage, while non-Life Sciences startups tend to focus their expenditures on applied research/product development instead of basic research. Many of these companies would not have attracted sufficient early funding without this government subsidy for research. This element of non-dilutive funding helps level the playing field allowing Life Sciences investors a return in terms of IRR although not necessarily so in terms of average multiple realized.
How do each of the types of Life Sciences companies do? Peeling the onion back one layer, below is the breakout for the four sub-verticals within Life Sciences (Note that we are now dealing with a smaller number of companies within each sub-vertical so the results are skewed a lot by the fact that the two biggest TCA returns within Life Sciences were both coincidentally in medical devices):
Key Takeaway:
- Life Sciences companies seem more likely to reach an exit, although often at lower multiples of investment. With the caveat that homeruns can occur in any industry, and those typically drive portfolio returns, TCA’s experience with 221 outcomes suggests that really large homeruns may be less likely in Life Sciences perhaps because 1) significant follow-on investment without large jumps in valuation dilute early shareholders and 2) strategic acquirers are poised to buy Life Science
companies soon after FDA approvals are realized and before significant revenues are achieved.
Tags:


 Wednesday, September 28, 2022