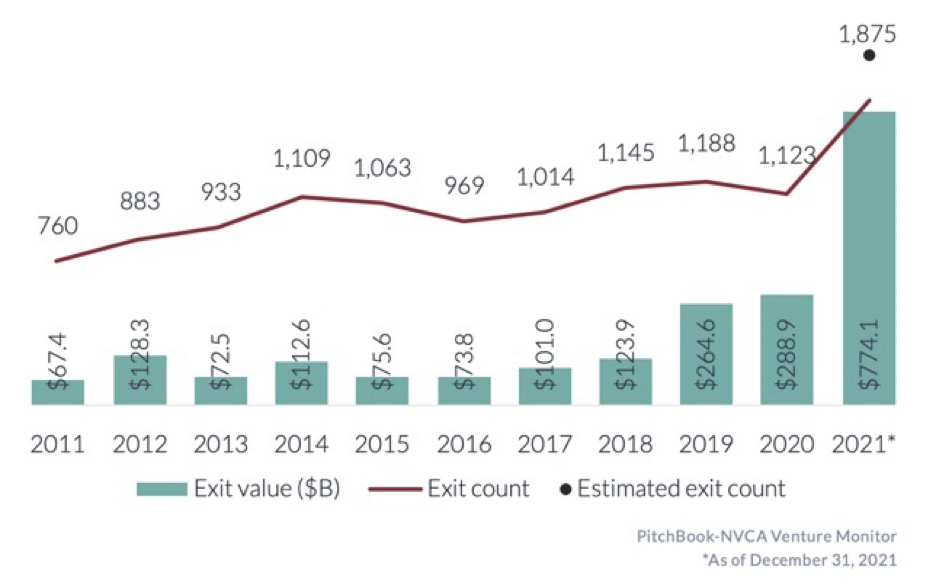
 Friday, December 30, 2022 Friday, December 30, 2022 The Equity Seller’s Bubble of 2021, Pt 1 of 2The Equity Seller’s Bubble of 2021 - Part 1This is Part 1 of a two-part examination of the state of the startup capital market during the past two years. Part 2 will explore the transition to an Equity Buyer’s Market in 2022. 2021 was an unusual year. Investors participated in record returns, capital raises, valuations, and founder-friendly deals, the most “exuberant” year for startup financing in two decades. What are the lessons we can learn about investing during and after startup capital market bubbles? How We Got Here—2021: The Peak of the Twelve-Year Bull Market and Startup Bubble It is an old rule of thumb that to understand startup markets today, measure the previous several quarters of M&A and IPO activity. Rising exits typically foreshadow a rise in venture activity as investors, encouraged by strong returns, plow new money into the startup economy. This is precisely what happened. The number and value of startup exits accelerated in 2019. The value received from startup exits reached a peak in 2021, 2.7x 2020’s exit value and 1.7x that year’s number of exits. (Figure 1)
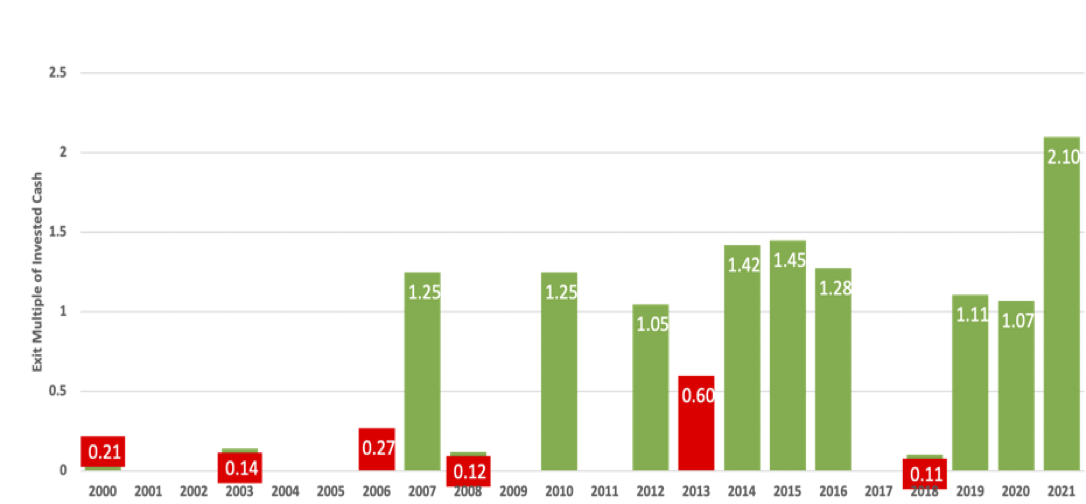
Figure 1: Exits and Exit $, 2011 to 2021 (Source: NVCA Venture Monitor) Angels, too, saw record returns in 2021 (Figure 2). As the ACA’s 2022 Angel Funders Report revealed, Angels received a record median multiple (2.1x) of their previously invested capital in 2021, nearly twice the median exit multiple of the prior year (1.07x), a level not seen in at least two decades.
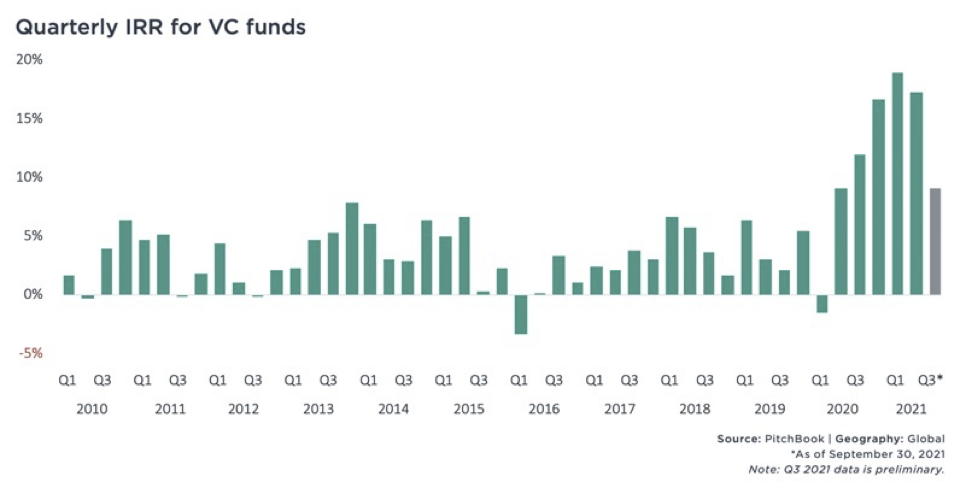
Similarly, beginning in 2020, the median quarterly IRR for venture funds globally reached levels also not seen in many years, growing to 3x and 4x the typical IRRs of the previous decade (Figure 3).
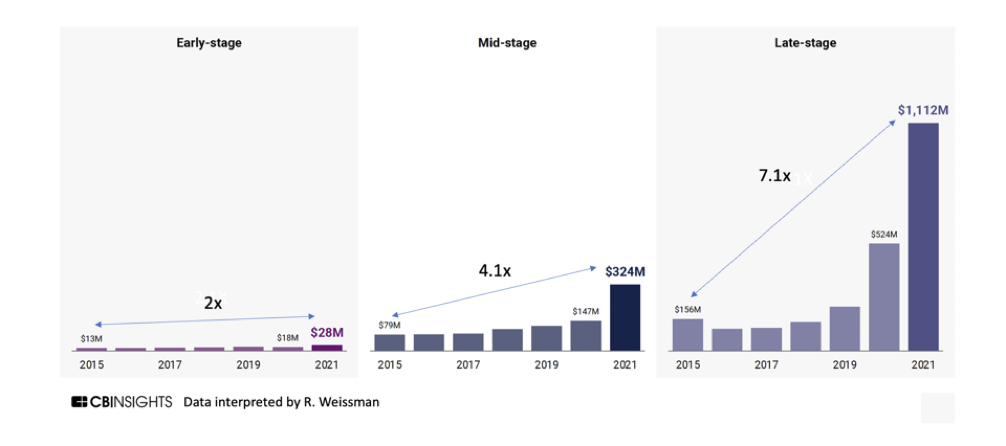
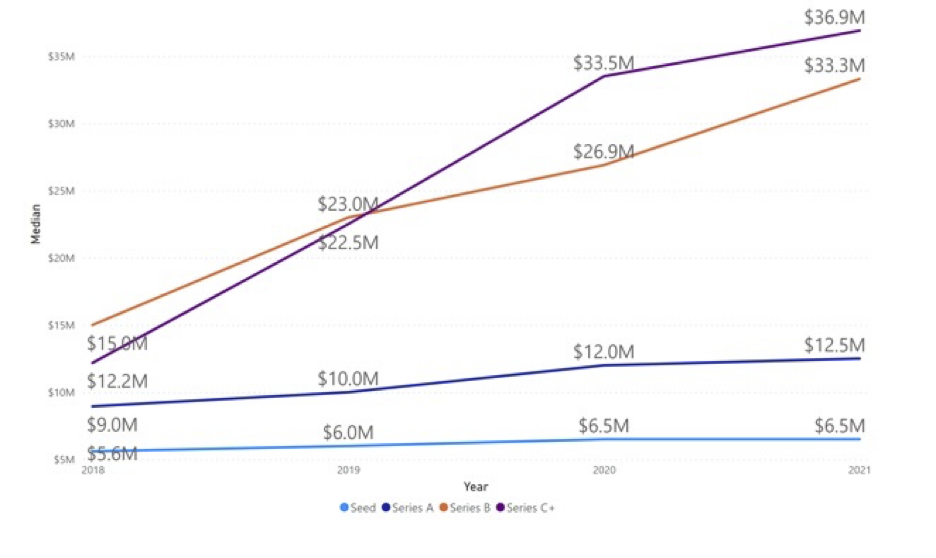
When investors receive outsized returns, private capital markets are soon flooded with new investor cash. From 2017 to 2020 the total amount of startup funding in the US nearly doubled, from $85B to more than $150B. In 2021 alone the amount invested in startups doubled to more than $300B. (Source: Pitchbook) In addition to traditional angel and venture investors, newer investors from family offices, private equity, hedge funds and corporate venture poured cash into venture funds as well as “buying” access to direct investments in hot startups. More cash and a surge in the size and number of funds helped create an equity seller’s market, fueling competition for deals at every stage. And more competition led investors to offer or accept higher and higher valuations to win those deals. It is no accident that this seller’s market also saw the increasing adoption of the least investor/management balanced deal structure, the SAFE note. SAFEs spread COVID-like, offering few investor protections and fewer (if any) provisions for Board-led healthy governance. As was true of prior bubbles, many of these SAFE deals were done quickly, with minimal diligence in classic FOMO (fear of missing out) speed. And many deal-makers were new to venture capital, never having managed funds or deals during down markets. The eagerness of some leading venture funds to invest in crypto exchange FTX in mid-2021 is only the most notorious example of low-diligence FOMO deals. Median valuations for mid-stage deals grew 4x in seven years and late-stage deals grew 7x during the same period (Figure 4). Even early-stage valuations were affected, growing less dramatically but still doubling over the same period as market comparables and management expectations were influenced by “anything goes” valuations.
Figure 4: Valuation Increases by Stage, 2015 to 2021 (Source: CB Insights) Valuations for seed stage deals managed by angels remained comparatively reasonable during this period (Figure 5). But early-stage deal competition wasn’t confined to experienced angel groups--it also saw the participation of many seed-stage tourists, infected by FOMO and eager to cash in on the current exit money flood. Non-traditional investors new to this asset class participated in record numbers, driving up valuations with new cash and an eagerness to buy their way into the buzziest deals. Many were new VCs or CEOs who had not lived through prior down markets and had no long-term experience of venture startup boom and bust cycles. Many came of age during the long bull market, where everything trades up.
Figure 5: Valuations by Stage (Source: 2022 Angel Funders Report, Angel Capital Association The most dramatic valuation increases were in 2021, the high point of the bull market. Overall, median early-stage valuations grew 55% and mid and late-stage valuations more than doubled between 2020 and 2021. Did deal quality increase at the same rate that valuations increased? Only if future exit valuations remained at 2021’s historically inflated levels. More cash and an equity seller’s market grew this quite visible valuation bubble. To summarize 2021: We saw the peak of the largest startup equity seller’s market in many years, where founders and management teams held most of the cards and could negotiate for extremely favorable valuations from investors anxious to win their share of hot deals. What are some of the characteristics of a seller’s market? And what lessons can angels learn? Appendices to the National Venture Capital Association’s (NVCA) latest model term sheet and investor rights agreement summarize and compare deal terms in 2021 with the medians of the previous five years by deal stage, enabling us to identify the distinguishing characteristics of that market.1 Key market characteristics include:
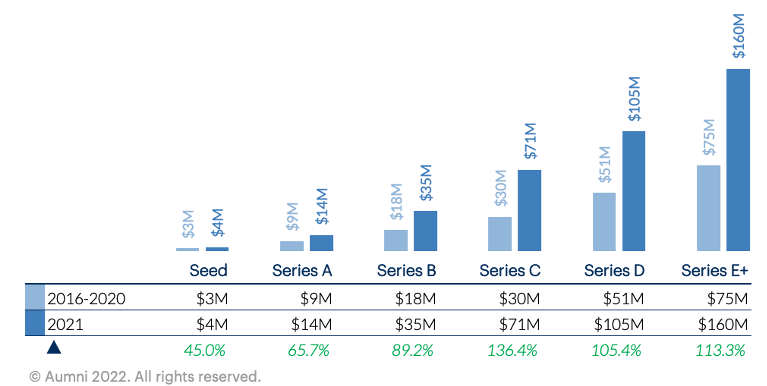
Larger Capital Raises. During 2021, the amount raised increased dramatically for every series, compared to the previous five years (Figure 6). For seed, median capital raised increased 45% from $3M to $4M; Series A increased 65% from $9M to $14M and Series B, from $18M to 35M (89% increase). Later rounds saw even larger funding increases, all with more than 100% growth over the median of the prior five years. (Figure 6)
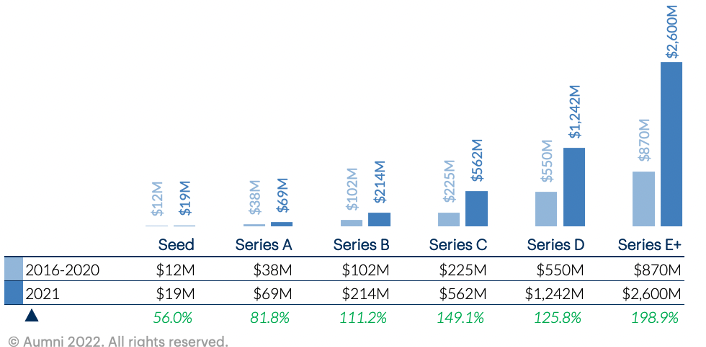
Figure 6: Median Round Size by Series (Source: NVCA/Alumni Enhanced Model Term Sheet 3.0) Higher Valuation. Median post-money valuations in 2016-2020 for Seed Stage priced rounds were $12M. In 2021, those increased by 56% for $19M. For Series A, previous five-year medians of $38M increased by 82% to $69M. Later stage valuations more than doubled, and by Series E, tripled compared to 2016-2020 (Figure 7). Notice the pattern: the later the stage, the greater the percentage increase over the reference “normal” period.
Figure 7: Post Money Valuation by Series (Source: NVCA/Alumni Enhanced Model Term Sheet 3.0) Valuation caps experienced a similar trajectory. These were 14% higher than the median of the prior five years for Seed stage and 20% higher for Series A. As with priced equity, Later stage caps were larger still, reaching 56% higher for Series C. For priced equity rounds, the increase in post money valuations, compared to prior years, was even higher: a 78% increase over prior years for Seed and a 91% increase for Series A. Along with the increase in round sizes and valuations, the amount of capital invested to be considered a “major investor” earning special rights grew substantially in 2021. Even Seed Stage was impacted, growing from a median of $500K to $818K in invested capital. For Series A, the amount invested to be considered major investors tripled, from $1M to $3M (Figure 8).
Figure 7: Post Money Valuation by Series (Source: NVCA/Alumni Enhanced Model Term Sheet 3.0) Valuation caps experienced a similar trajectory. These were 14% higher than the median of the prior five years for Seed stage and 20% higher for Series A. As with priced equity, Later stage caps were larger still, reaching 56% higher for Series C. For priced equity rounds, the increase in post money valuations, compared to prior years, was even higher: a 78% increase over prior years for Seed and a 91% increase for Series A. Along with the increase in round sizes and valuations, the amount of capital invested to be considered a “major investor” earning special rights grew substantially in 2021. Even Seed Stage was impacted, growing from a median of $500K to $818K in invested capital. For Series A, the amount invested to be considered major investors tripled, from $1M to $3M (Figure 8).
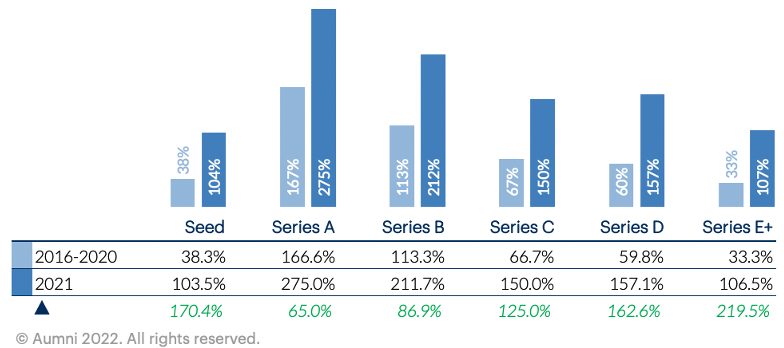
Unsurprisingly, step ups to the next round were also substantially larger in 2021 than in the prior five years. (Figure 9). The median capital raised during Seed rounds in 2021 was 103% more than the prior round. And this was 2.7x larger than median Seed Stage step ups for the preceding five years.
Figure 9: Median Step Up from Prior Round Financing (Source: NVCA/Alumni Enhanced Model Term Sheet 3.0) Deal Terms. Apart from valuation and funding, most deal terms remained stable in 2021. Liquidation preferences remained constant at a founder-friendly 1x. At the same time, given the equity sellers’ market, some investor-friendly terms were reduced. Thus, while major investors retained prorata investment rights, the extension of those rights to all series investors was pared back significantly, particularly at later stage. And the percentage of deals with investor redemption rights, never a large number, were reduced further in 2021, often by as much as 40% to 50%. Investors did gain a modest increase in legal expense budgets across all deal stages. In other respects, for priced equity rounds, most deal terms remained constant between 2021 and the previous five-year reference period, including the size of corporate boards. For non-SAFE deals, little changed apart from dramatic increases in funding and valuation. Key Takeaways:
Looking Ahead to Part 2:
1The data is based on Alumni’s study of 200,000 transactions across 90,000 investors. (For the latest term sheet and associated deal data, see: https://www.aumni.fund/resources/new-enhanced-model-term-sheet-v3-0. Similarly, see https://www.aumni.fund/resources/new-enhanced-model-investors-rights-agreement.) Please note that several of the charts in the Alumni appendix (not used here) are mislabeled, having been copied incorrectly from previous charts. The raw numbers, however, appear to be correct. Tags: |